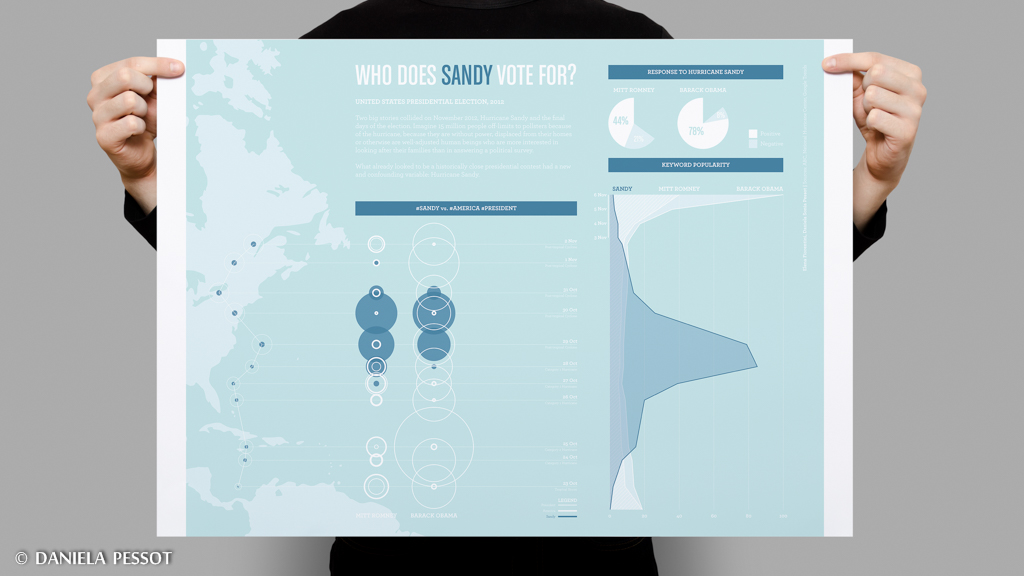
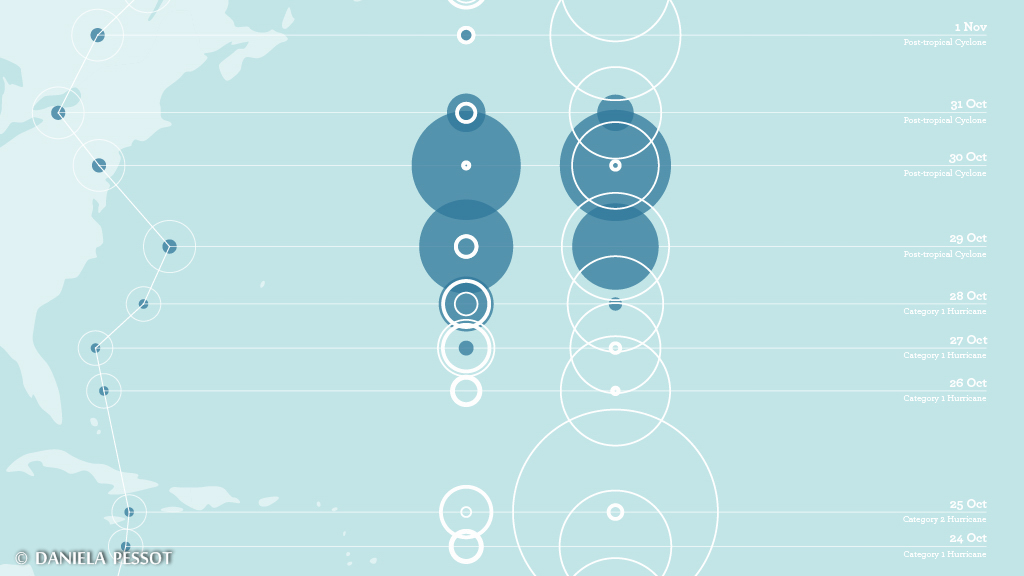
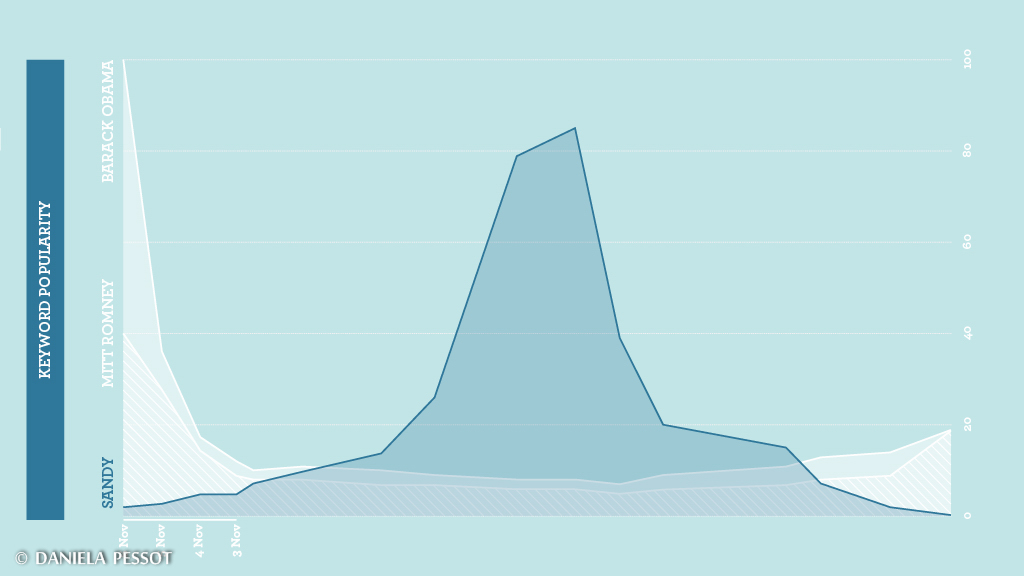
Infographic poster on the relation between the 2012 US presidential elections and hurricane Sandy, presented at the 2012 Visualizing Global Marathon. The poster has a clear, minimal style and analyzes the places and times of the events (with a map and a timeline) and the reaction of the social media, with data about the hashtags that appeared.


